Yesterday I was having problems with some open connections stored in python objects that should have been garbage collected. For some strange reason, the objects created were referenced somewhere and my task was to find exactly where.
Finding the problem in my code
My first step was to find what piece of code was triggering the problem. The
good part was that the problem was being triggered by functional/end to end
tests. After a number of tests, the test runner was freezing. We use
py.test, so I used the --full-trace flag to show a full stack trace
on Control-C.
After seeing the full stack trace, I understood that the code was having a
problem opening new connections. As my ulimit is usually low, I confirmed
with my RabbitMQ server that it ran out of connections, thus
clients were left blocked waiting.
Debugging
I jumped into the place where my code was calling the method that was hanging the test runner. I added a global counter to see when I should fire pdb: print its value in each iteration, wait the code to hang and add an condition to start pdb right before it blocks. Now how could I find the object that isn't being collected?
Thanks to the counter I knew how many times I've called that piece of code and how many objects I should expect to find. Using objgraph I could find how many objects of a class where in the system. Taking into account the original stack trace you can have some candidates.
(Pdb) objgraph.count("Celery")
138
(Pdb) objgraph.count("TCPTransport")
137
References
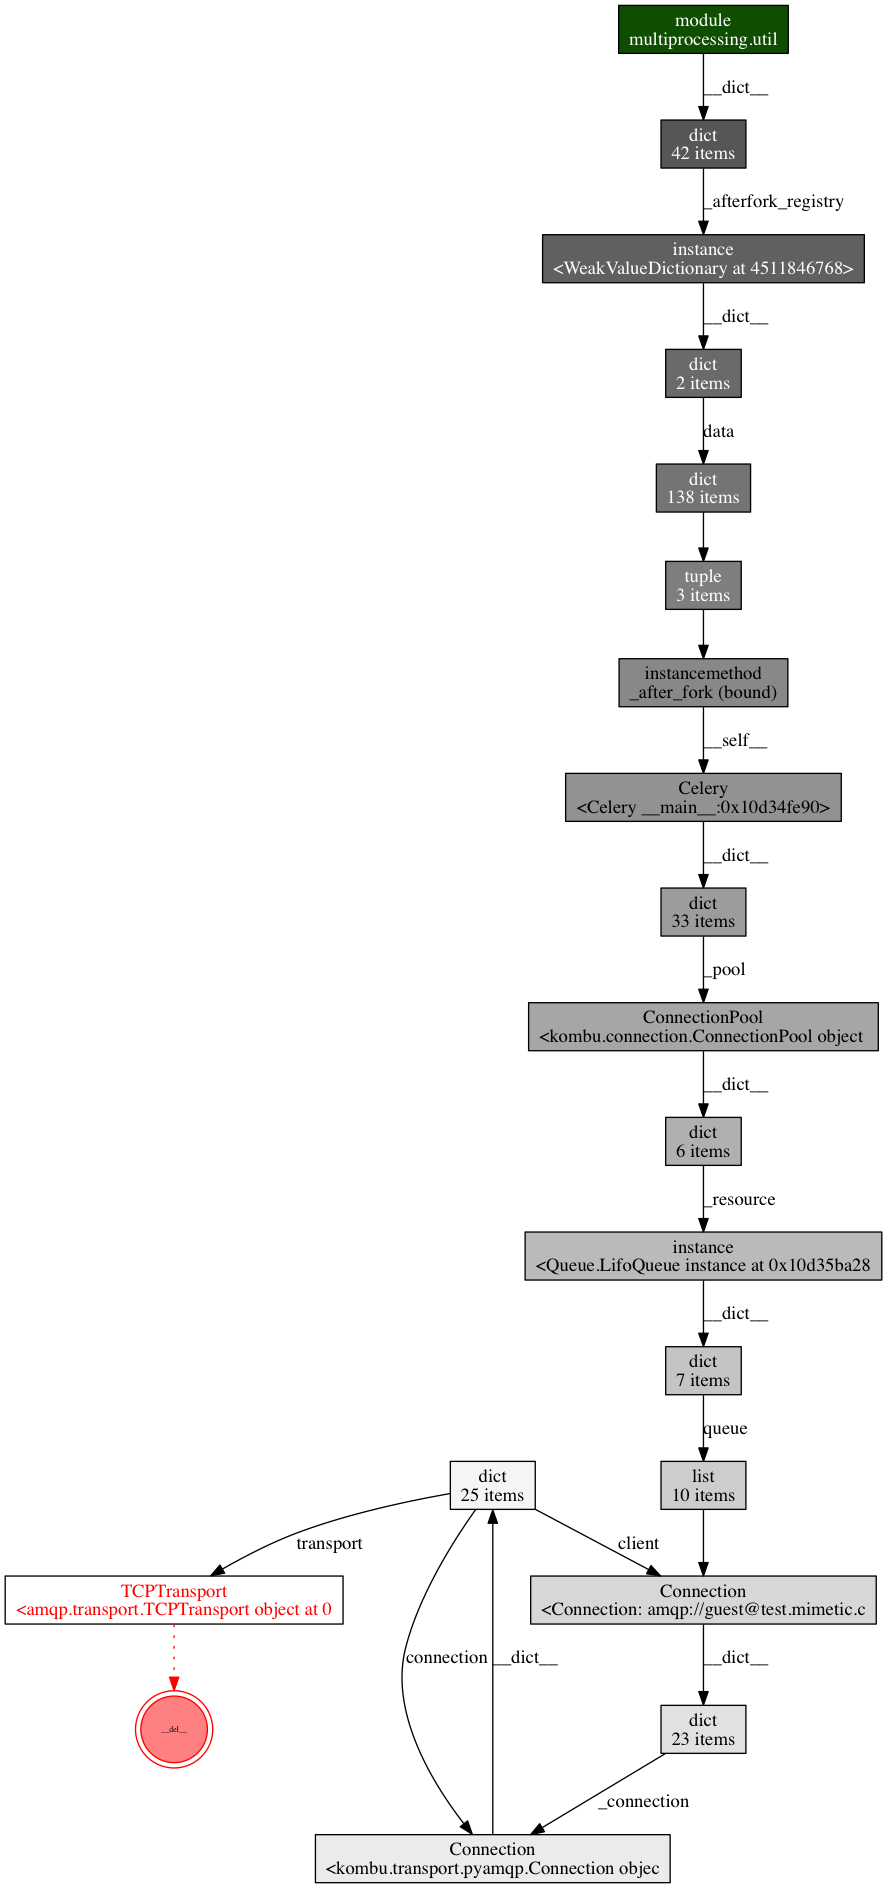
Objgraph allows you to find references and to draw references (using graphviz). The first guide you will see in their documentation is to take one random object and find a chain of references from a module to that object. Modules are a good place for globals and globals might keep references to objects that shouldn't be there in the first place.
(Pdb) objgraph.show_chain(objgraph.find_backref_chain(objgraph.by_type("TCPTransport")[5], objgraph.is_proper_module))
Graph written to /tmp/.../objgraph-6JEOw4.dot (19 nodes)
Graph viewer (xdot) not found, generating a png instead
Image generated as /tmp/.../objgraph-6JEOw4.png

So somewhere in the code, a reference is added in a global inside the multiprocessing module. But after removing that, I still had problems and the defaults from objgraph weren't helping.
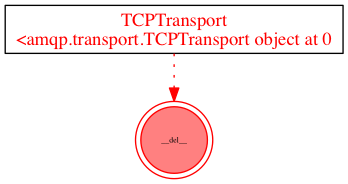
(Pdb) objgraph.show_chain(objgraph.find_backref_chain(objgraph.by_type("TCPTransport")[5], objgraph.is_proper_module))
Graph written to /tmp/.../objgraph-sWp8r6.dot (1 nodes)
Graph viewer (xdot) not found, generating a png instead
Image generated as /tmp/.../objgraph-sWp8r6.png

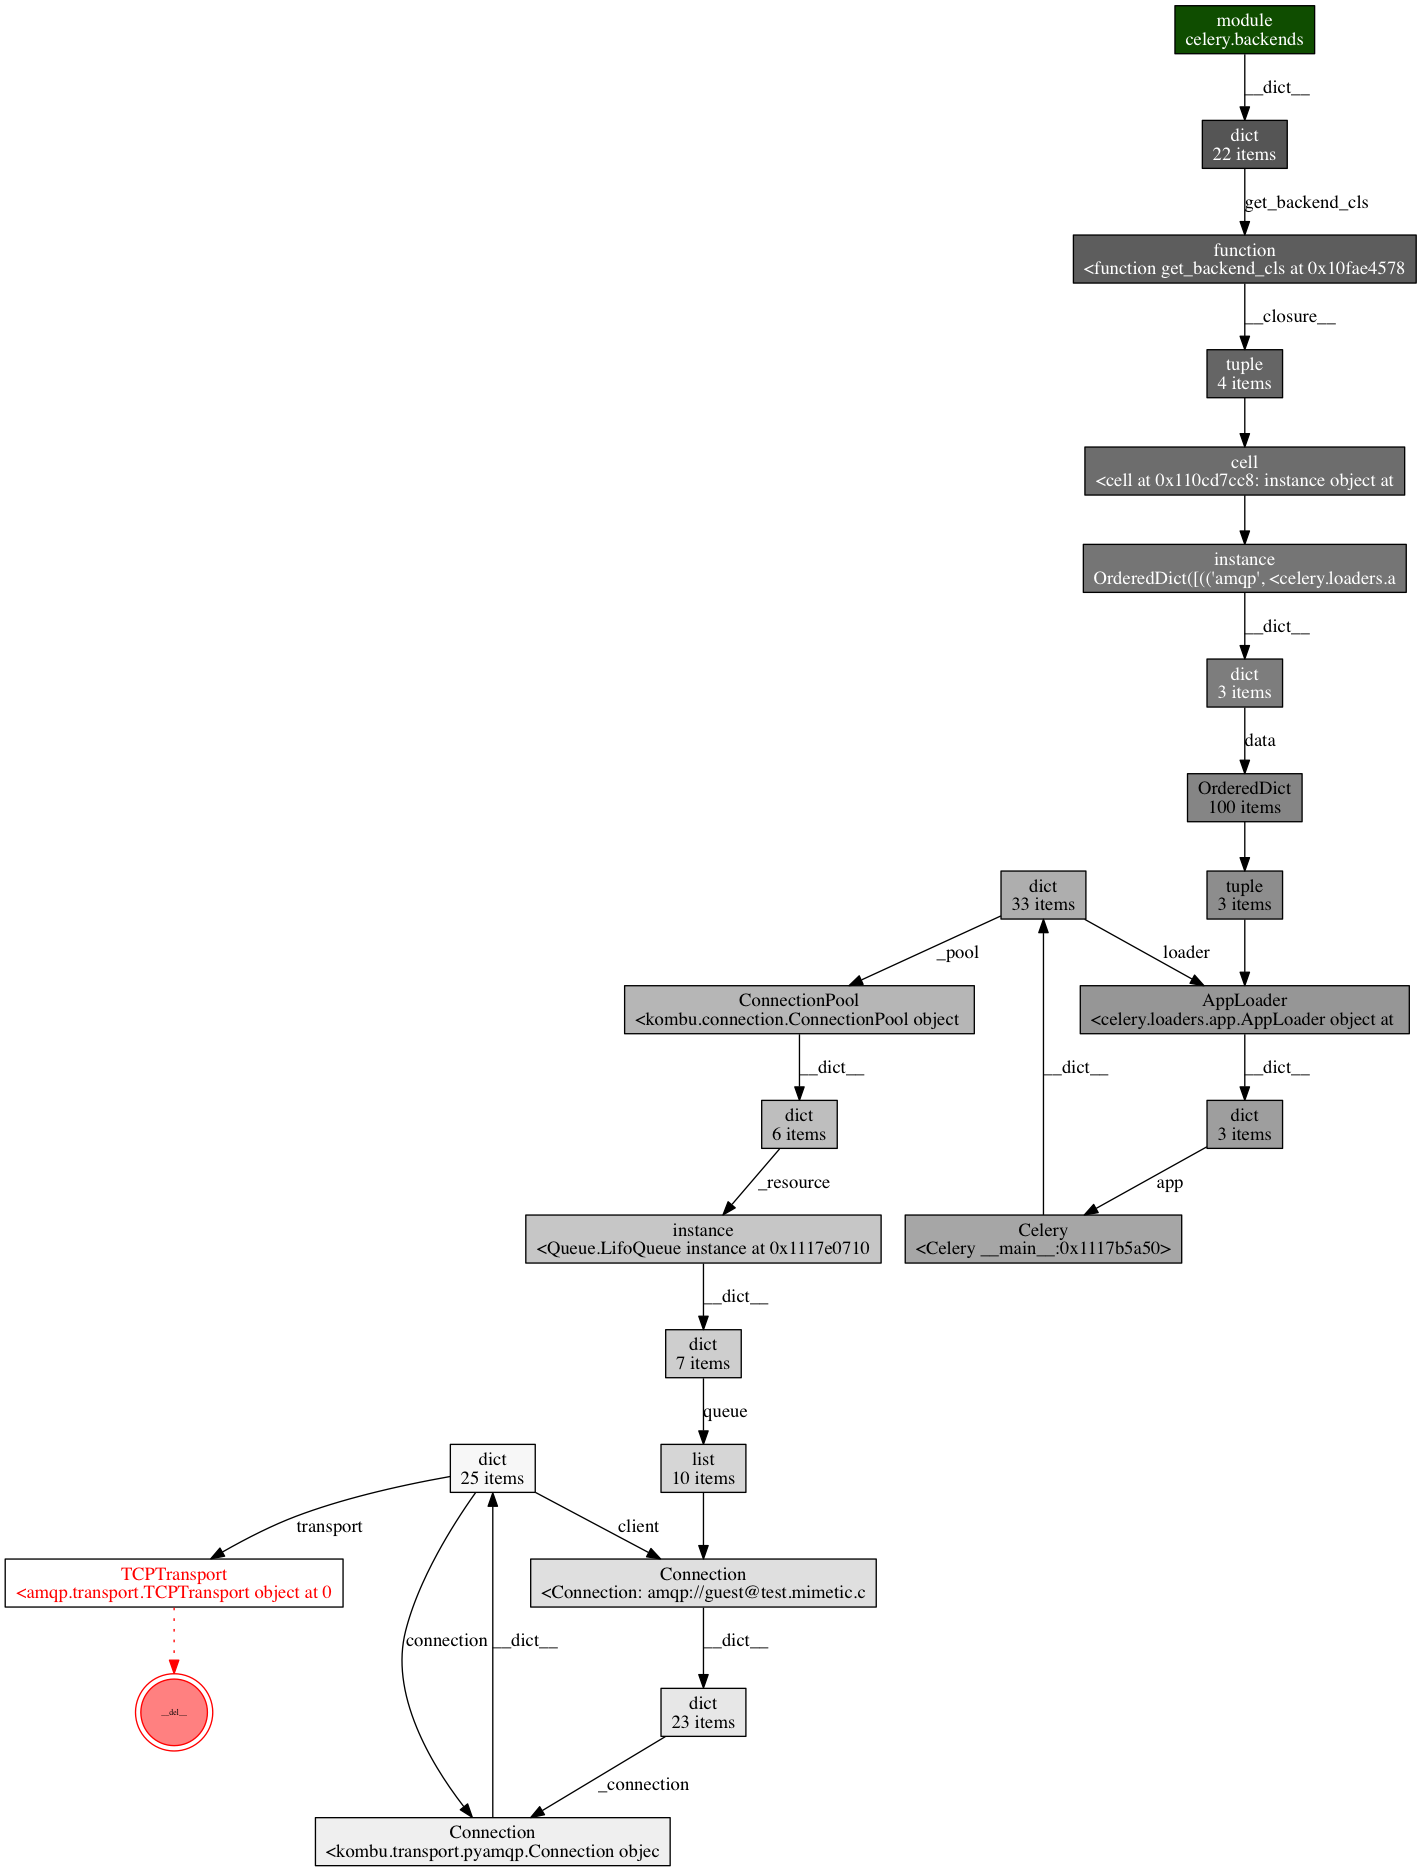
One node only? I need to widen the search with the max_depth parameter to
find the last leak.
(Pdb) objgraph.show_chain(objgraph.find_backref_chain(objgraph.by_type("TCPTransport")[5], objgraph.is_proper_module, max_depth=50))
Graph written to /tmp/.../objgraph-uMU0Tr.dot (23 nodes)
Graph viewer (xdot) not found, generating a png instead
Image generated as /tmp/.../objgraph-uMU0Tr.png

Summary
This report was posted in the celery issue tracker and the issue was fixed. Kudos for the celery team and specially to Ask Solem for fixing the problem. Also note that you might find problems with big amounts of objects as my friend @jcea told me. Although in this specific case, objgraph helped a lot.